Unit 6 Populations and the Environment
Overview
Unit 6 brings us the topics of populations and the environment. In this unit we look at the demographic area of populations and fertility and how the environment is impacted by human action. The resources you’ll encounter in this unit provide a broad historic sweep of social factors that have influenced fertility rates, family sizes and population growth and decline. We will then focus on how human populations interact with the environment including a brief introduction to urbanization and climate change. Theoretical perspectives are provided to guide both population changes and environmental impact.
Learning Outcomes
When you have completed this unit, you should be able to:
- Explain the effects of population size and urbanization on life experiences
- Consider the interrelationship between the natural and built environments we live in
- Recognize the problematic relationship between population and environment
Activity Checklist
Here is a checklist of learning activities you will benefit from in completing this unit. You may find it useful for planning your work.
Learning Activities
- Watch the Hans Roslin video, Population Growth (15 minutes)
- Watch What is a Population Pyramid? (15 minutes)
- Read Academics Change Patterns (15 minutes)
- Watch Social Class and the Environment (15 minutes)
- Read Urbanization (15 minutes)
Assessment
- See the Assessment section in Moodle for assignment details and due dates.
6.1 Populations
Up to this point, much of our discussion has been about individuals, small groups and social institutions. When looking at populations we need to think even bigger than we have so far – yet not forget that a population is still made of individuals making choices and who are being influenced by society. In order to put this topic in perspective, imagine a small group of people shipwrecked on a small deserted island. The small group of people are the population and the small island is their world. The next questions to answer are going to be about how to survive. What will they eat? What if there is not enough food? Where will they live? Who will they live with? Will they have children? With who? How many? What about questions of health such as disease, injury or old age? Maybe you don’t like the deserted island analogy, so make it an abandoned colony on Mars or a group stuck in a bunker after a nuclear war. You get the point that with a small isolated group, we get a glimpse of how our planet works.
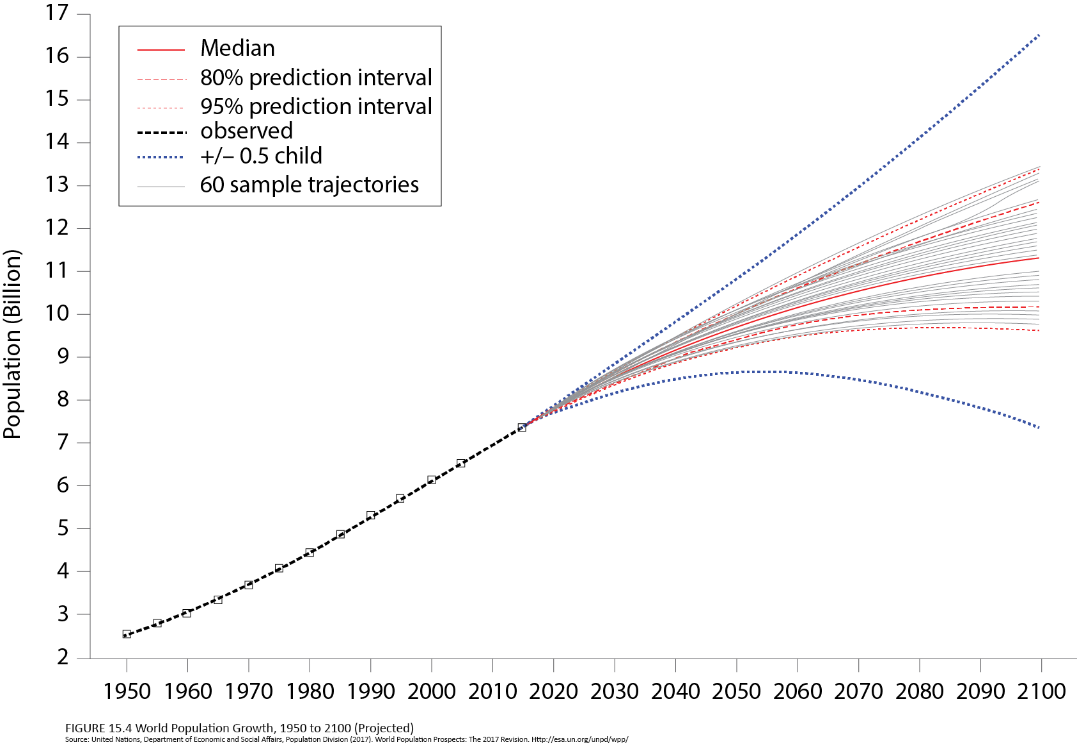
Why does a population grow or decline? During much of the past 200 years, social scientists have been concerned about the Earth becoming overpopulated as the population levels worldwide have grown exponentially. Recent data suggest a slowing down of population growth and some have suggested that the population may start declining by the end of the 21st century (as you will see in the Hans Roslin video). Figure 15.4 (see below) shows mathematical models that include historical data and projected data to try to determine the future world population. You should know that a fertility rate of about 2 is what keeps the population level. It is really closer to about 2.1 to take into account infant mortality but 2 is the number to keep in mind. Think that it takes 2 people to make a baby (with natural fertility) and if 2 people have 2 babies, the population will stay the same. Less than 2 it will decline, more than 2 it will grow. You can see by the diagram that the bounds of estimates are based on only an addition or reduction of .5 children. Consider a fertility rate of 2.5 children per woman compared to 1.5 children per woman to make sense of the boundaries. Also keep in mind that these are population level statistics, so if 30 women had a total of 45 children between them, the fertility rate would be 1.5.
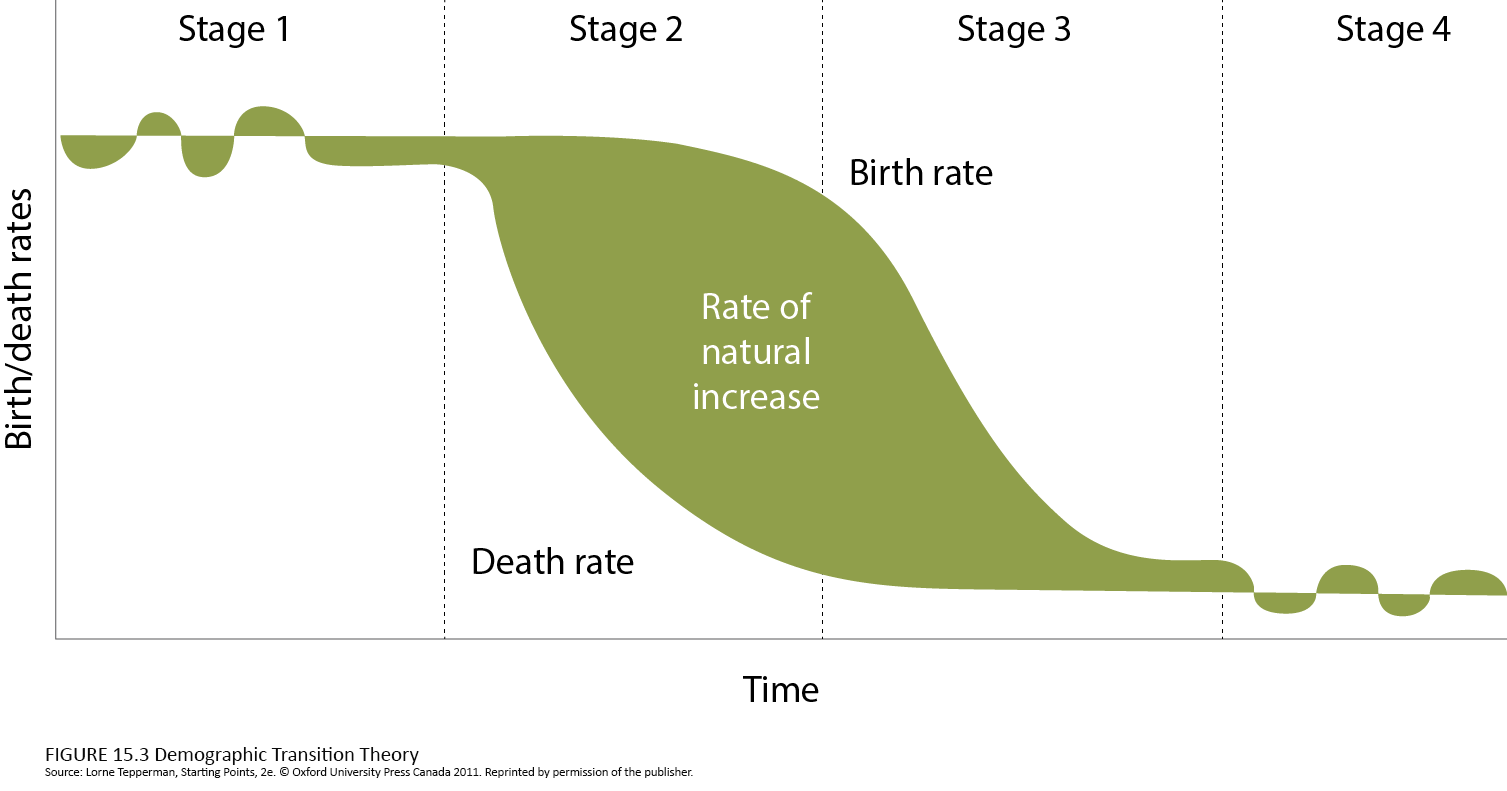
The different theoretical perspectives about population are well illustrated in the text. We want to focus on Figure 15.3 because it takes a more descriptive approach and provides the broad historical overview we are looking for in this chapter. This perspective does not diminish the important contribution that the other theories provide. For example, symbolic interactionism is not concerned with the broad sweeping demographic overview. It is more interested in why people have children at all and what does parenthood mean today in a post industrial society with low infant mortality, verses historical periods in which most parents experienced the death of one of their children.
The demographic transition theory states that as technological developments proceeds, health improves, infant morality decreases and longevity increases. As a result we have less children and restore the equilibrium of the population. As you see in the diagram below, stage 1 is typified by high birth rates and high death rates; stage 2 sees the death rate decline but the birth rate remain high; stage 3 sees the death rate beginning to decline along with the death rate; and stage 4 sees the equilibrium restored. The population growth between stage 1 and stage 4 is the result of the delay in the birth rate catching up with the decline in the death rate.
Activity: Population Growth
Watch the video below to see a visualization of population growth from Hans Roslin as he connects the earlier convergence video you watched with global population trends.
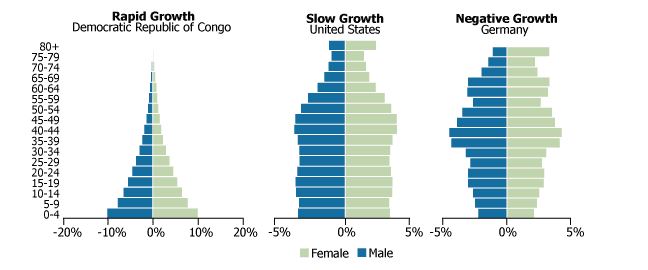
Figure of growth rate of Congo, United States and Germany
Another way to look at group population patterns over time is with a population pyramid. A population pyramid is a graphical representation of the population of a country or group and represents the number of males and females in different age cohorts. The population pyramid can illustrate change in a population over time.
Source: Jeff Desjardins, Visual Capitalist
Activity: Population Pyramids
Watch the video below to learn more about population pyramids.
Next, go to the population pyramid link below and research your own country’s population pyramid.
Questions to Consider
After completing the activities above, answer the following questions:
- What makes my countries population pyramid the shape it is?
- What are the historical social factors that influenced its shape?
- What are the implication for my country based on the shape of the pyramid?
Feel free to answer the questions in your notes or Reflective Learning Journal.
6.2 The Environment
Sociologists have historically been more interested in how the environment shapes human and social behaviour, but more recently they have been focused on how human behaviour and social interaction affect the environment, both natural environments and built environments. We touch on a few high points of this topic. As scientific evidence mounts to support the magnitude of how human activity influences climate change, the way humans behave with the environment becomes a more important topic for sociologists to study.
Scientists of all types are now looking at ways in which their own disciplines are working against the benefit of the environment. Read the article below and ask yourself ways in which you can reduce your carbon footprint.
Activity: Academics Change Patterns
Read the article, Academics Change Patterns
Activity: Social Class and the Environment
Box 15.1 of your text discusses the relationship between inequality and pollution. Your understanding of theoretical perspectives should already have you thinking about the ways in which different classes experience the environment. Research points to the inequality in living conditions based on economic resources. The lower the social class, the more likely a person is to live in a polluted environment.
Watch the video below and then discuss with your peers the way this principle can be illustrated in your own community.
The natural environment has an influence on how and where people live. The move of human society from an agrarian to an urban environment is what early sociologists were impacted by. They saw the disconnection from traditional social attachments like family and religion to a more individual focus in an urban world. Urbanization influenced family structure, family size, family residence and economic marketplaces to name a few. Take a moment and reflect on how people would live in a major city if there were not cars or mass transit available? Do think they would live closer to their place of work? What about the educational institutions people attended? How did you get to school today?
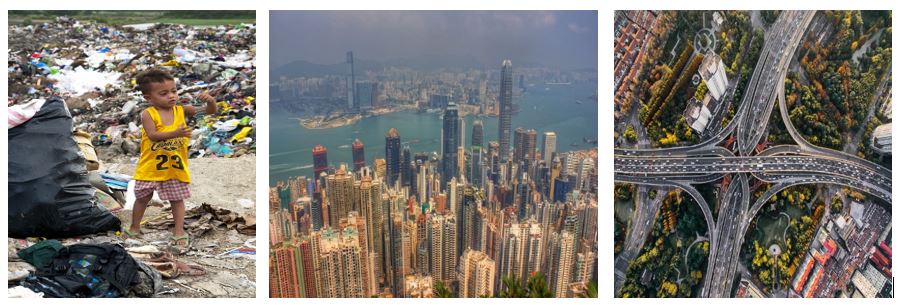
left to right:Child playing near a grabage dump, Image of a city skyline and Image of intersections of multiple flyovers
Activity: Urbanization
Explore the link below and reflect in the way the world is changing. What impact has urbanization had on your life?
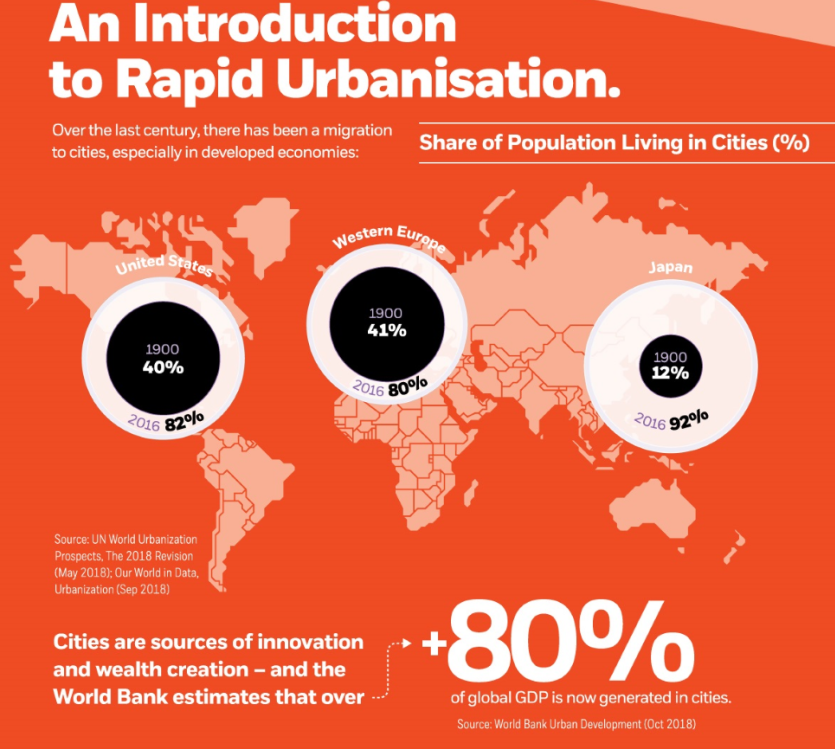
Infographic of rapid urbanisation
Questions to Consider
After completing the activities above, answer the following questions:
- Consider the social impact of technological advancement. For example, how has the elevator changed the way we live? What about the automobile? The smartphone? The internet?
Summary
In Unit 6 we took at macro look at populations. We focused on demographic issues such as fertility and transition theory. This approach can seem detached from people’s lives and the decisions that you make on a day to day basis, but these macro trends have an influence on your own decisions. There is a reason most of you are not married with children. There is reason why you are not planning on having eight children or more, there is a reason you are not living on a farm raising animals and crops. All of those reasons are bigger than you, but they have influenced your decisions.
The population affects and is affected by the environment. You saw how a rapid increase in the population of the world over the last 200 years has impacted the environment, both natural and built. Climate change is attributed to human action or inaction, the rapid raise in urbanization of the world is a direct result of economic and technological systems that are humanly made. Urbanization continues to shape the decisions we make and the lives we live. It is all social.
Assessment
Quiz 15
After completing this unit, including the learning activities, you are asked to complete the online quiz reviewing material from chapter 15.
These quizzes are meant to be formative, and a tool to help you measure your own understanding of the course material.
Go to Quizzes in the main Assessment tab for access to Quiz 15. Note that the quizzes will be administered in the Learning Lab.
Be sure to practice with the online quizzes from the textbook.
Assignment: Reflective Journal
The Reflective Journal assignment is a chance to present your understanding and application of the course material, ask questions, and clarify issues. We are looking for evidence that you are engaging the course material. Examine the learning outcomes for each unit and ensure that your journal addresses each outcome. Include your thoughts from the learning activities and how you apply the concepts to your life and current events.
Refer to the Assessment section in Moodle for all other assignment details and due dates.
Checking your Learning
Before you move on to the next unit, you may want to check to make sure that you are able to:
- Explain the effects of population size and urbanization on life experiences
- Consider the interrelationship between the natural and built environments we live in
- Recognize the problematic relationship between population and environment